Methods Corner: What is an effect size?
 by Adar Ben-Eliyahu, Ph.D.
Most studies focus on “statistical significance,” or the probability that certain findings are reflected in the data. To test this, researchers actually propose a “null hypothesis,” (e.g., mentoring has no effect on self-esteem). If the data show that the null hypothesis has less than a 5% chance of being right, we say it’s wrong (or p-value of .05 or less), and hence our theory is supported. However, large samples can lead to significance even when the effects are small (and vice versa). So there is also importance in considering how substantial the observed effect is. That is, how much do mentors affect self-esteem. To test this hypothesis, we would compute a correlation and consider not only the chances that this correlation significantly differs from zero (by looking at the p-value), but also at the size of the correlations. When looking at the magnitude of the correlation, we focus on the effect size.
Types of effect sizes
There are two types of effect sizes:
1) One type examines the relations between two constructs/variables, and is called a correlation. We use r to symbolize a correlation.
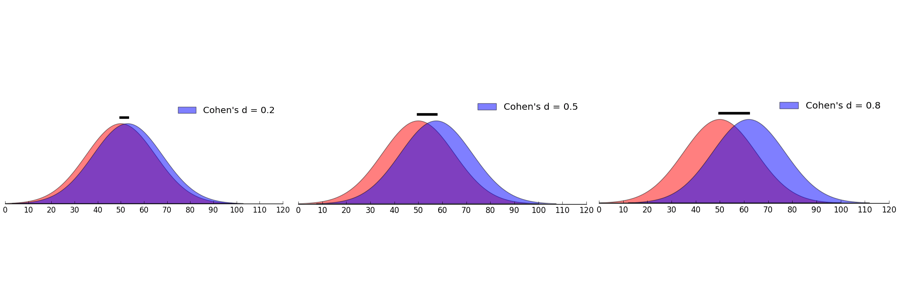
2) The second type is when comparing two groups. This can be two separate groups, such as mentored versus non-mentored youth; or the same group tested twice, such as comparing the same group of people before and after an intervention. We use a d to denote a comparison of this sort.
How big is an effect?
In considering effect sizes, Cohen (1969) suggested categorizing effects into small, moderate, and medium. The value of the effect depends on whether one computes a correlation (r) or a between group analysis (d) as follows:
r: small- .10, moderate- .30, large- .50
d: small- .20, moderate- .50, large- .80
The effect size indicates the magnitude of the finding. Clearly, a large effect size is deemed meaningful and important. However, this does not mean that a small (but significant) effect size is meaningless – especially when the research design is well constructed and alternative explanations are ruled out.
Sometimes, our effects may be small because of limitations with our measurement tools (e.g., survey). There are two situations when an effect size may not be found because there is not enough range in the answers, even though there should have been. One situation is when the upper range of the scale is limited so participants report high levels as their answers (known as a ceiling effect). The opposite may also occur – when the lower range of the scale is limited so that participants tend to report low levels (known as a floor effect). In these situations, we may not be able to capture the full range of the effect due to limitations with our measurement tools (e.g., survey).
What does this mean?
Effect size is an important indicator of the meaningulness of findings. Although small effects are common in the social sciences, and may have widespread implications, they should be taken with a grain of salt. Large effects are indicative of potentially important findings. Most current research reports focus on how likely an event will occur (significance test or p-value) rather than it magnitude (effect size) and how meaningful it is. However, there is a current trend to include both forms of analyses in research findings, as it is important to know the impact that an intervention has, and the chances that the studied effect is a real one. Please let me know if I can answer any questions about this!