Missing in the Margins: Estimating the Scale of the COVID-19 Attendance Crisis

By Hailly T.N. Korman, Bonnie O’Keefe, and Matt Repka, Reprinted from Bellwether Education
Introduction
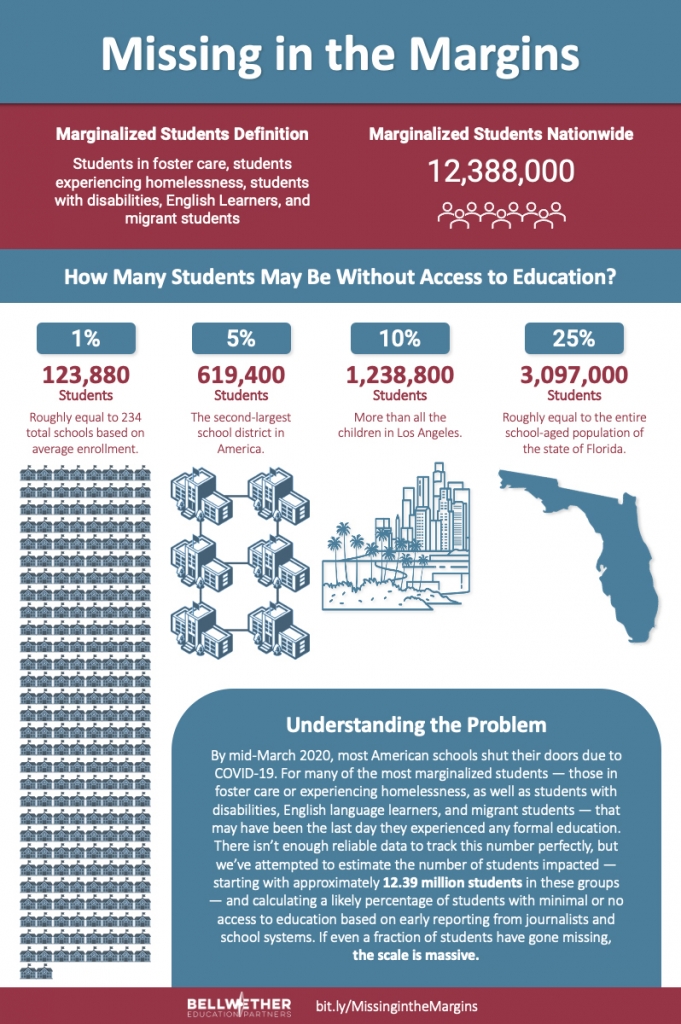
It’s 2020. Do you know where 3 million students are?
By mid-March 2020, most American schools had shut their doors, and about half remain fully or partially closed to in-person learning today. For approximately 3 million of the most educationally marginalized students in the country, March might have been the last time they experienced any formal education — virtual or in-person. (To see how we estimated 3 million, click here. To see a state-by-state breakdown of these estimates, click here.)
Stories from across the country illustrate pieces of this crisis:
- In Los Angeles, 15%-20% of English learners, students in foster care, students with disabilities, and homeless students didn’t access any of the district’s online educational materials from March through May.
- In Washington, D.C., back-to-school family surveys found that 60% of students lacked the devices and 27% lacked the high-speed internet access needed to successfully participate in virtual school.
- In Miami-Dade County, 16,000 fewer students enrolled this fall compared with last year.
Because COVID-19 has disrupted education for almost every student in the country, more severe effects on some groups of students can seem comparatively small. And in the ongoing chaos of the pandemic, reliable data is scarce.
We’ve attempted to estimate the total number of students experiencing the gravest consequences of school closure and the shift to distance learning by identifying the groups most at risk, and calculating a likely percentage of those groups not in school based on media reports and available data.
If even one in four students with disabilities, English learners, students in foster care, migrant students, and homeless students have been shut out of education for months, that adds up to over three million students, as if the entire school-aged population of the state of Florida dropped out of school. If only one in 20 of America’s most educationally marginalized students did not access any education in the midst of the ongoing pandemic, the number of students out of school would create the second largest school district in America, almost 620,000 students. The millions of students who face the greatest barriers to an education span age ranges and geography, but are more likely to live in urban areas.
The consequences for these students’ education and well-being are not marginal concerns: They are an emergency.
Why aren’t students attending school?
The reasons that as many as 3 million young people aren’t attending school are complex. But the scale is massive. It is well known that many students lack the devices and Wi-Fi access to fully participate in virtual instruction. National analyses suggest that before the pandemic, as many as 16.9 million children lacked home internet access, and 7.3 million children did not have a computer at home. These students disproportionately live in low-income households and are more likely to be Black, Latinx, or Native American. Gaps in technology access persist today even after efforts this spring in many school districts to directly distribute technology or reach students in other ways.
But the students we’re focusing on here need much more than a laptop. For example:
- Many English learners and students with disabilities have no good options to receive the educational accommodations and services to which they are legally entitled, making learning inaccessible.
- Children in foster care and children experiencing homelessness encountered barriers to education before the pandemic, and this year, instability, confusion, and poor communication are rampant for them.
- Some young people have transitioned to work, both formal and informal, while others are providing full-time primary care and learning support for other children, like younger siblings, in their homes.
- The pandemic has also isolated children and youth experiencing abuse, neglect, or acute mental health needs, cutting them off from teachers and other school staff trained to spot warning signs. Early local reporting suggests widespread decreases in child abuse reporting, increases in child deaths, and more older children being killed.
What will happen if these students don’t get back to school?
The long-term consequences of this crisis are difficult to estimate without seeming hyperbolic. Once a student leaves school, it is difficult to reenter. One study of a large, urban district found that two-thirds of high school dropouts never reenrolled, and among those who do, about half drop out again. Circumstances that might push a student out of school today are very different, but even if all of the currently missing students return to school as soon as they are allowed to do so, months of missed opportunities for learning could mean permanent setbacks.
We know that other, much shorter disruptions to learning can have long-term consequences on students’ knowledge and skills, achievement, path to college and career, and lifetime wages. Absent a remarkable and long overdue investment of resources and interventions, students who were already at an educational disadvantage will lag even further behind their peers who had access to education during this time. These educational effects of the pandemic will be compounded by the effects of increased job loss, housing instability, and adverse health consequences of COVID-19, all of which fall harder on low-income families. The sum total of this disruption will echo through generations and communities, and there is no clear end point in sight.
How did you estimate 3 million missing students?
 The lack of any reliable attendance data to understand how many and which American students have functionally disappeared from school for the past seven months is itself evidence that this crisis is not well understood and
needs greater attention.
We arrived at an estimated 3 million students using two broad methods. (Enlarge the infographic at right for more.)
First, we monitored media reports and district and state survey data for indications of which student groups were having difficulty engaging in or accessing education in spring and fall 2020. These sources led us to identify groups at highest risk of not having access to remote education and estimate a percentage range of students within those marginalized groups.
For example:
- Detailed data on spring engagement released by the Los Angeles Unified School District showed that English learners, students with disabilities, students experiencing homelessness, and students in foster care in middle and high school were all less likely than their peers to log into the district school platform in the spring.
- 6%-10% of students in these subgroups did not log in at all from March to May, and an additional 10%-15% logged in but did not view any educational materials or complete any assignments.
- In Boston, reports suggest approximately 20% of students did not participate in virtual school in the spring.
- In Memphis, data from Shelby County School District indicated that 3% of students had not logged into virtual school or claimed a device this fall.
- In Chicago, 10%-16% of students missed the first few days of virtual school this fall.
- Across the country, school districts are seeing markedly lower enrollment rates, especially in kindergarten. In Washington state, kindergarten enrollment dropped by 14%.
Next, we compiled existing federal data sources to estimate how many students fell into higher-risk groups in every state and nationally, using data sets from the U.S. Department of Education and the Department of Health and Human Services on the total student population and the following subgroups:
- Students in foster care
- Students experiencing homelessness
- English learners
- Students with disabilities (ages 6-21)
- Students eligible for the Migrant Education Program
We did not include racial subgroups or students eligible for free and reduced-price lunch in our estimate. Although students of color and low-income students are undoubtedly more likely than their peers to experience educational disruptions during this time on top of the ongoing effects of classism and racism, we decided these groups were too large, and overlapped too much with the other groups of interest, to add meaningful estimates.
We also weighed the fact that a disproportionate number of students in higher-risk groups attend schools in urban districts that are less likely to offer in-person school options because of facilities challenges, lack of resources, or other reasons. Based on this information, we estimated that between 10% and 25% of students in most marginalized groups are likely to have had minimal or no educational access since schools shut down in March.
A raw sum of the super subgroup of students for which we have data is approximately 13.3 million students. But these groups overlap. For example, a student might be an English learner with a disability who is experiencing homelessness. No individual-level, deduplicated student data is available, so we accounted for estimated overlap between groups wherever we could to arrive at an estimate of approximately 12.4 million students. Ten to twenty-five percent of that 12.4 million would be between 1 and 3 million students.
To see estimates of marginalized students for all 50 states and D.C., click here. For deduplication methods, discussion of other known limitations of our methods, and data sources, see the appendix.
Our estimate of 3 million students includes both the missing — children who are offline and hard to find but would reengage in school if given the opportunity — and the gone — children and youth who have made a transition away from school engagement in ways that could be permanent.
What should leaders do about these missing students?
The answer is not to open school buildings indiscriminately, especially in communities with high levels of COVID-19 transmission and districts with insufficient resources, facilities, and processes to protect students, families, and staff.
While there are no easy solutions to this problem, there are obvious next steps.
First and foremost, public leaders at every level of government must develop, implement, and enforce coherent, science-based strategies to mitigate the effects of the COVID-19 crisis, stomp out community transmission, and eventually enable safe community reopenings, prioritizing a safe return to school for all. Schools, children, and families alike cannot solve the underlying problem that has disrupted education for every child in the country. We are education policy professionals — not doctors or epidemiologists — but it is clear that there are no true solutions to our current educational crisis without addressing the public health crisis constraining many of our options both in and out of school.
There are four additional things that public leaders can do to support the millions of students who face the greatest barriers to an education:
- School districts and states must collect and report disaggregated attendance data in real time and internally identify and follow up with individual students who went missing between spring and fall.
- Schools, districts, and communities must develop and implement attendance intervention strategies that start with an informed understanding of students’ unmet needs — and avoid punitive approaches that exacerbate those needs.
- Social service agencies, telecommunications companies providing Wi-Fi access, and community-based organizations must work with local and state education agencies to develop coherent and integrated plans that meet the unmet needs of each community’s most vulnerable children. Children and families in crisis often receive uncoordinated help from too many sources, leading to more frustration and gaps in services — and this crisis has been no different.
- State and federal government leaders need to provide guidance, funding, and resources for schools and other social services to support these plans. Safe returns to school, intensive educational and child welfare interventions, and coordination between schools, districts, and social service agencies in the current moment all require additional funds to implement effectively. Expecting schools and other public and nonprofit service agencies to do more with less could leave vulnerable students worse off than they already are.
See Bellwether’s Resources to Support Special Populations During COVID-19 for more.
There is not enough public recognition of the serious challenges facing America’s most vulnerable students at this moment or of the consequences if millions continue to be disconnected from schools and other support systems indefinitely. Not only are educational futures at stake, but in some severe cases, students’ basic safety and well-being are in jeopardy.
There remains tremendous work to be done to both fully understand the scope and scale of this problem and to take steps to intervene. We look forward to others’ efforts to complement or build on this estimate as well as alternative ways to conceptualize this problem. If you are interested in a deeper look at this question, please contact the authors.
Appendix: Data Methods, Limitations, and Sources
There are many known limitations to the data we used to estimate the total size of the most marginalized student groups nationally and in each state.
Our model includes homeless students, students in foster care, special education students, English learners, and students eligible for migrant education services. There are other student groups known to have high barriers to accessing education for whom there is no reliable data at the state and national levels. To start, there is no reliable single data set for young people who are pregnant or parenting, a life experience correlated with dropping out of school. We also could not identify the count of current high school dropouts: students aged 18 and below who are not enrolled in school and do not have a high school credential. Additionally, all data is from 2017-18, and student populations have grown since then.
We also could not find consistent, reliable estimates of school-aged children who were already hidden and who are some of the most vulnerable. For example, we could not find state-by-state data on school-aged children who are undocumented, nor could we get close enough to the number of school-aged children who have been detained, deported, or expelled at the border. In the past, many of those students would have been processed through our immigration systems and released to family or sponsors in the U.S. and then would have been entitled to enroll in local public schools. We also could not find any state-by-state estimates of runaway youth or unaccompanied homeless children 18 and younger, an experience that is more likely to be had by LGBTQ youth.
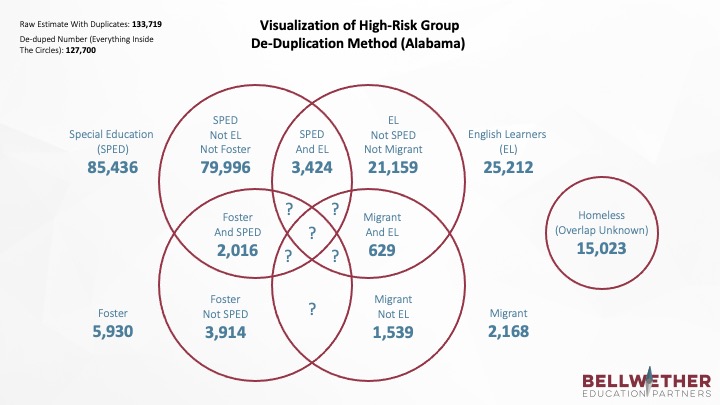
The exact formula we used based on available data to arrive at this estimate was: homeless students + (foster care, not SPED) + (foster care, YES SPED) + (SPED NOT EL, NOT foster care) + (SPED, YES EL) + (EL not sped not migrant) + (EL, migrant) + (migrant, not EL). The graphic below illustrates an example of this method applied to the state of Alabama:
Furthermore, we know that there are young people who have experienced or are experiencing multiple disruptive experiences, but estimates on the rates of overlap between these populations are at best a moving target. Some considerations:
- One dimension of overlap, the percentage of students in foster care receiving special education services, is derived from a national estimate of overlap rather than state-level data. All other overlap estimates are drawn directly from federal datasets.
- There is no data on the overlap between students experiencing homelessness and other student groups of interest.
- The overlap of more than any two groups is also unknown, however, we believe those numbers are comparatively small.
- The estimate of students for Wisconsin was calculated differently because the U.S. Department of Education has suppressed data on Wisconsin students in special education.
Data sources
| Total student population | National Center for Education Statistics. “Table 203.20. Enrollment in Public Elementary and Secondary Schools, by Region, State, and Jurisdiction: Selected Years, Fall 1990 Through Fall 2029.” Digest of Education Statistics. Accessed October 19, 2020. |
| Students in foster care | The Annie E. Casey Foundation. “Children in Foster Care in the United States.” Kids Count Data Center. Updated March 2020. |
| Students experiencing homelessness | United States Department of Education. “McKinney-Vento Act: Homeless Students Enrolled by State.” Ed Data Express. Accessed October 19, 2020. |
| Students eligible for the Migrant Education Program, 2018 | United States Department of Education. “Eligible Migratory Students Served by Type of Service.” Ed Data Express. Accessed October 19, 2020. |
| English learners | National Center for Education Statistics. “Table 204.20. English Language Learner (ELL) Students Enrolled in Public Elementary and Secondary Schools, by State: Selected Years, Fall 2000 Through Fall 2017.” Digest of Education Statistics. Accessed October 19, 2020. |
| Students with disabilities | United States Department of Education. “IDEA Section 618 Data Products: State Level Data Files.” Office of Special Education and Rehabilitative Services. Accessed October 19, 2020. |
| Students with disabilities who are not English learners | United States Department of Education. “IDEA Section 618 Data Products: State Level Data Files.” Office of Special Education and Rehabilitative Services. Accessed October 19, 2020. |
| Students with disabilities who are English learners | United States Department of Education. “IDEA Section 618 Data Products: State Level Data Files.” Office of Special Education and Rehabilitative Services. Accessed October 19, 2020. |
| English learners who are not students with disabilities | Estimated by subtracting the number of students with disabilities who are English learners from the total number of English learners. |
| Children in foster care receiving special education | Estimated as 33% of the total foster care population based on the National Working Group on Foster Care and Education, which cites two studies estimating that between 36% and 47% of youth in foster care receive special education services.
Legal Center for Foster Care and Education. “National Working Group on Foster Care and Education.” National Working Group. Accessed October 19, 2020. |
| Children in foster care not receiving special education | Estimated as 66% of the total foster care population based on the National Working Group on Foster Care and Education, which cites two studies estimating that between 36% and 47% of youth in foster care receive special education services.
Legal Center for Foster Care and Education. “National Working Group on Foster Care and Education.” National Working Group. Accessed October 19, 2020. |
| Students eligible for the Migrant Education Program who are English learners | United States Department of Education. “Eligible Migratory Students Served by Type of Service.” Ed Data Express. Accessed October 19, 2020. |
| Students eligible for the Migrant Education Program who are not English learners | United States Department of Education. “Eligible Migratory Students Served by Type of Service.” Ed Data Express. Accessed October 19, 2020.
|
Acknowledgments & Credits
The authors would like to thank ESC for infographics and video creation, Super Copy Editors for proofreading support, Michelle Lerner for outreach assistance, and Giant Rabbit for layout customization. A number of Bellwether colleagues made this work possible: Jennifer O’Neal Schiess, Andy Rotherham, Tanya Paperny, Alyssa Schwenk, and Lindsay Ferguson. Thank you additionally to Carnegie Corporation of New York for support. Any errors are the responsibility of the authors alone.
You can contact the authors of this work to offer feedback or suggestions here.
To access the resource, please click here.
Related posts:
 COVID-19 Learning Gap: Opportunities for Educational Re-invention
 The Fear of Speaking Out About Mental Health Is Persistent. We Need to Reach Out to Each Other
 Helping Behavior May Mitigate Academic Risk for Children from Low-Income Neighborhoods
 The youth mental health crisis is real, but teachers can’t solve it alone


